Twisted Tower
by Tuğrul Yazar | February 23, 2012 00:42
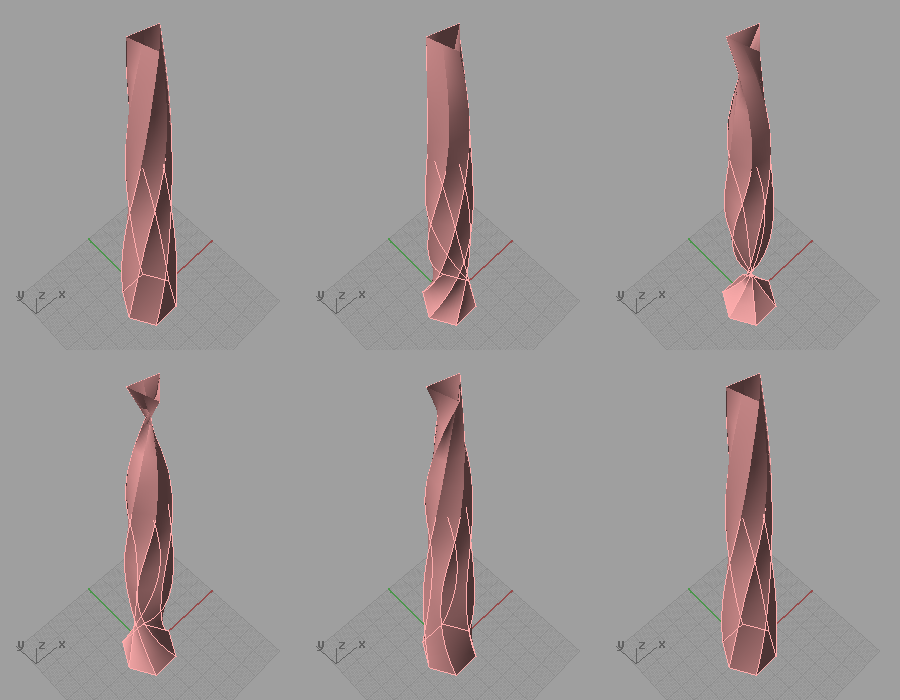
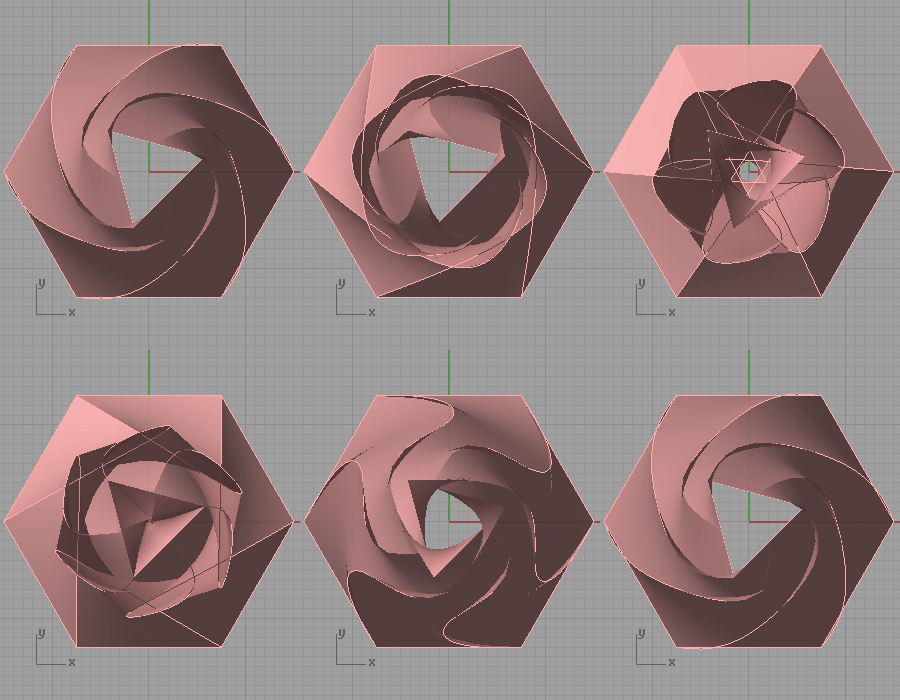
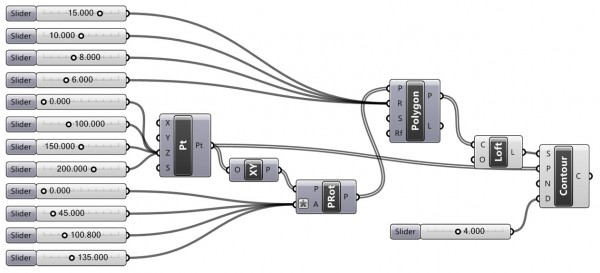
Maybe a huge kitsch for contemporary architecture, I know, but a good example of a fundamental problem of constructing geometric relationships. In ARCH362 today, we’ve examined the geometric modeling process that opens us to parametric relationships just by converting it into a diagram of design history. You may follow the construction of such a diagram step by step and see the possible parameters emerge from it. The only rule of this construction is the connection from the left side of the component (node) represents an input to that node, and the connection from the right side of the component represents an output of that node. A couple of numbers are the input of a “polygon” node, while the output of that node is a curve (the polygon). Then, this goes on as we use that emerged curve as an input of a loft “node”. In this example, lists of data are created and manipulated, resulting in an exercise of “data lists matching”. We’ll discuss this later.
You can download the definition file here [GHX: 0.8.0066][1]
 [2]
[2]Please note that in this method, first, a geometric sketch is made in Rhino to create an initial object. Then, parametric relationships are developed and new alternatives are explored. In the optimization phase, the parametric definition is simplified by joining similar data flows into data lists. Like all methods in parametric modeling, this also is not suitable to model the one-time-only form of a design. It rather constitutes the concepts of emergence, exploration, and design alternatives. A similar exercise “cellular canopy” is described earlier on this website.
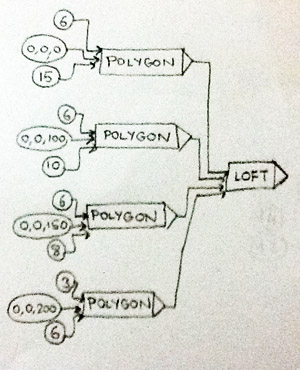
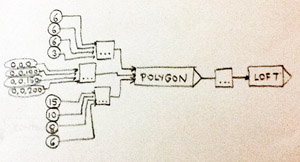
Of course, Grasshopper is not limited to this method of diagrammatic deduction. There are other concepts and methods to be studied later.
- [GHX: 0.8.0066]: https://www.designcoding.net/decoder/wp-content/uploads/2012/02/2012_02_23-tower.ghx
- [Image]: https://www.designcoding.net/decoder/wp-content/uploads/2012/02/2012_02_23-tower-def.jpg
Source URL: https://www.designcoding.net/twisted-tower-frenzy/