Quick Parametric Curves
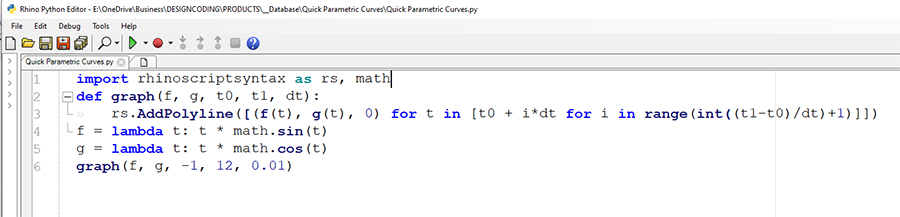
Here is the shortest possible way of generating quick parametric curves in Rhino Python. So, you may change the f, g, and h functions to test any function curve. In this Python code, the list comprehension [(f(t), g(t), h(t)) for t in [t0 + i*dt for i in range(int((t1-t0)/dt)+1)]] works by first generating a list of t values from t0 to t1 with an increment of dt using the inner comprehension. The outer comprehension then iterates over these t values, computing the x, y, and z coordinates for each point using the functions f(t), g(t), and h(t), respectively. Finally, this results in a list of 3D points I used rs.AddPolyline to create a polyline in Rhino. In Python, a lambda function is a small anonymous function with one expression. This means, it is evaluated and returned when the function is called.
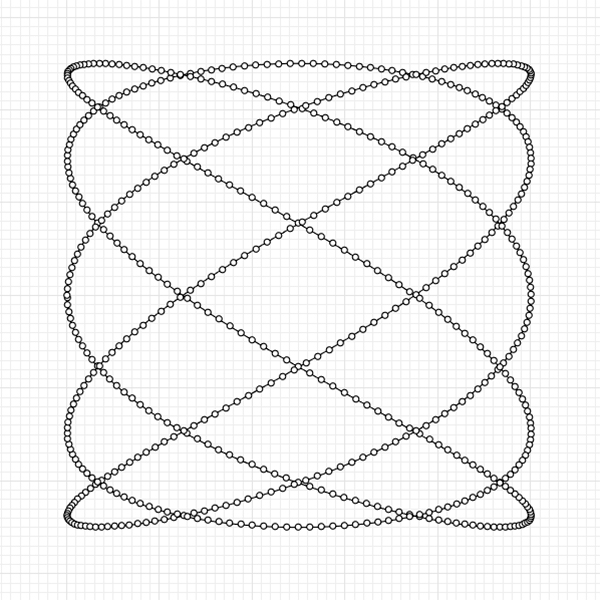
This Python script generates a parametric curve in Rhino based on user-defined functions f and g. They define the x and y coordinates of points along the curve. The graph function iterates over a range of t values from t0 to t1 with a step of dt, calculates the coordinates using f and g, and adds the polyline to Rhino.
You can rewrite this code by looking at the image. It is fairly simple for an intermediate Rhino Python user. However, it is very educational for a beginner. You may change the lambda functions for various curves. On the other hand, if you like what I do, and want to support me, would you consider being a Patreon? Here is the link to my Patreon page, including the Rhino Python code of Quick Parametric Curves and more.