Grasshopper for Beginners (1)
by Tuğrul Yazar | November 22, 2022 13:28
This is a new series aimed at beginners in Grasshopper. The design method pioneered by Grasshopper[1] with the way he defines geometric relationships is becoming increasingly popular today. Its interactive interface, which looks like a game or a puzzle at first glance may seem easy and its impressive geometric results are a little dazzling. But when you enter the world of Grasshopper, it is understood that it is not a simple toy at all. It is very difficult to get anywhere without a good understanding of the unique methods that distinguish Grasshopper. For this reason, it is necessary to experiment a lot and to have foresight about which ways to go to solve which kind of design geometry problems.
This series, in which we share the experience we gained while teaching Grasshopper to architects and designers, comprehensively explains the basic features of the language and includes applications at different levels. We explain the different uses of Grasshopper in this series. We prepared it in such a way that you can put the information on top of each other.
1.1 What is Grasshopper and Who are the Beginners?
You don’t need prior coding skills to start this series. It is for beginners in Grasshopper. We invite designers, design students, and faculty members, as well as anyone who wants to meet parametric design for hobby purposes only, on the challenging but enjoyable journey of Grasshopper.
Grasshopper (GH) is a plug-in that runs on Rhinoceros (Rhino) modeling software. We use it for purposes such as algorithmic shape research and real-time parametric modeling. In computer-aided design software, commands produce geometric results by processing the inputs they receive from their users. Rhino does not store the data (such as geometric objects, numbers, and coordinates). Moreover, it does not store the relationships between these data. For example, when you create a surface and make changes to the curves that define that surface, your model will not update. Rhino has a feature called Record History[2] to create such basic relationships. However, it can associate with a limited set of commands. It is not very useful as a design method because it does not visualize the established relationships.
The “Hello World” of Grasshopper
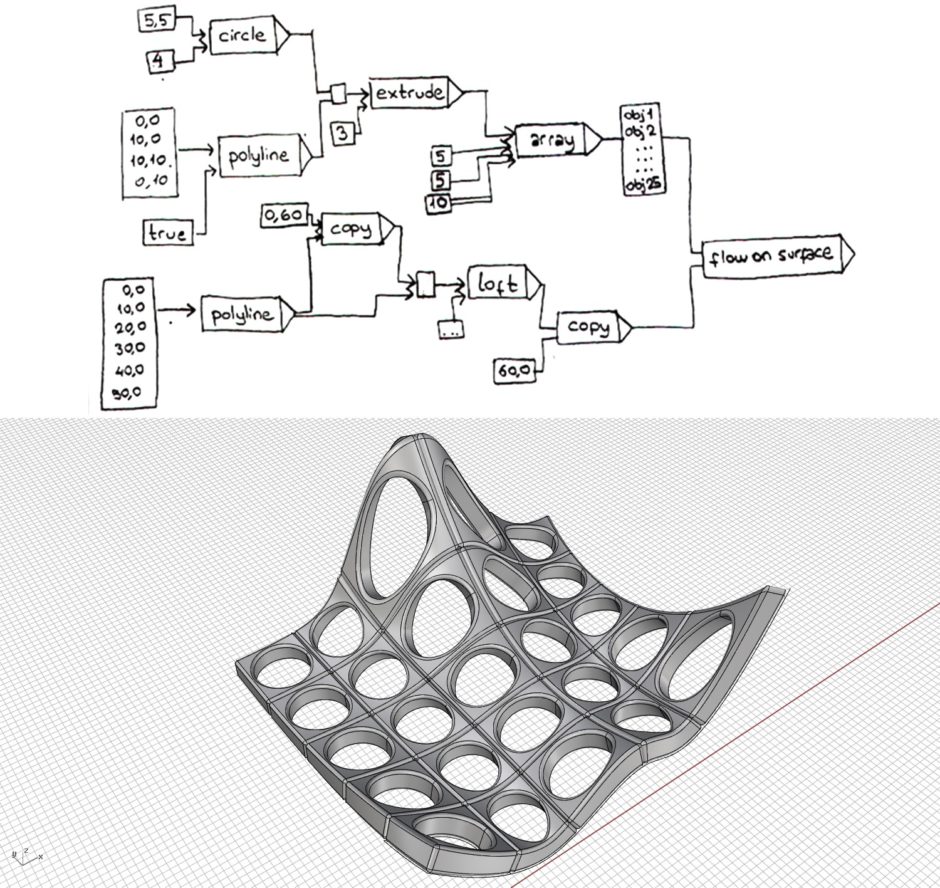
If we want to visualize the inputs and outputs of the commands we use in a modeling process, we can make a diagram like the one below:

We write down all the commands we use in the modeling process on a piece of paper. We write commands in a box and obtain the results from the commands (geometric objects) by drawing links between them. The numerical values that we enter into the commands are also nodes and are connected to the relevant command. In the above figure, we connect a coordinate and a number to the Circle command.
This means that we use these two parameters as inputs of the Circle command. The link on the right side of the circle command represents the data (circle) obtained from the command. We connect this data and the number 3 to the Extrude command. From there it turned into another data and continued on its way. As you can see, according to this representation, we consider numbers, coordinates, or geometric objects as data. Such diagrams, in which we visualize where data “flows” between commands in a geometric modeling process, are what we call Dataflow Diagrams[3].
The aim of such diagrams is to create relational structures of a modeling process. So you get a clear, relatable, and reproducible diagram of any decision you make. The generally accepted rule in data flow diagrams is to process the data by entering it from the left side of an instruction and, to get the result obtained from the command from the right side. For this reason, we read these diagrams generally from left to right.
That’s it for today… We will continue the Grasshopper for Beginners.
- Grasshopper: https://www.grasshopper3d.com/
- Record History: https://www.designcoding.net/tag/record-history/
- Dataflow Diagrams: https://www.designcoding.net/tag/dataflow-diagram/
Source URL: https://www.designcoding.net/grasshopper-for-beginners-1/