Custom Graphics on VPL?

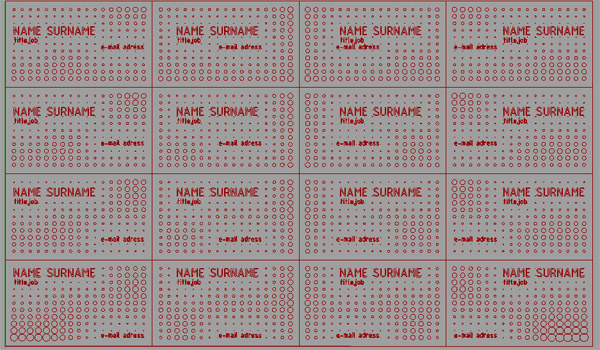
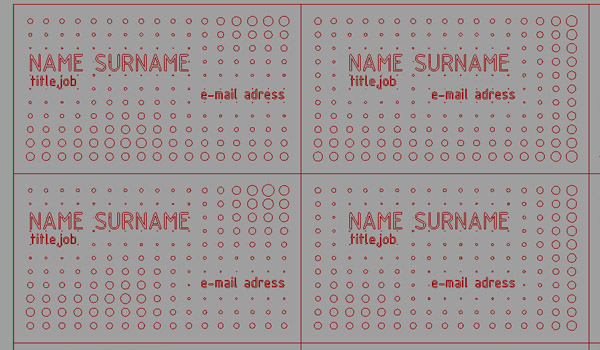
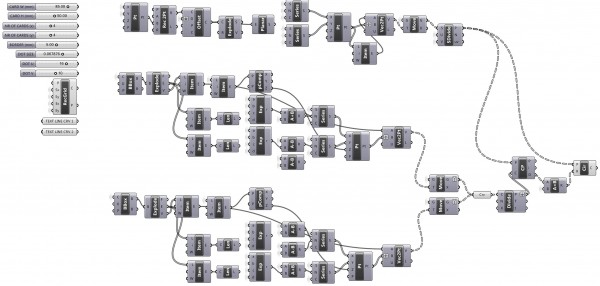
This was an interesting challenge for me to find out if an architect can use Visual Programming Languages (VPL’s) also for graphical purposes? Now, I would say “not exactly” because this definition took much time than I expected. The aim was to create an algorithm for a business card design that has variable outputs. Each card should be different, but without using any randomization. This is achieved with a definition you can check here: [2012_01_10-cards] and Rhino file here [3DM:2012_01_10-cards] to take inputs such as your name and e-mail address. This project is suitable for more development because now it is only producing one sequence of difference. I’ll post first laser outputs when I make time to cut this set. Anyway, that was a good exercise on list management and the use of comparsion components such as “closest point on curve”. In theory a simple attractor of x-y shifted curves (text) on a bunch of circles should have solved that. But I couldn’t make a list of points to search for a closest point on another list of curves. Sounds easy but I couldn’t figure it out as the component insists on finding one solution for each point. So I changed tactics and got advantages of a more powerful component of “find closest point on a point cloud”, by dividing text curves into several points and search within them. This definition is powerful in putting any text into the selected layout properly (as far as I tested).


